Uploading an accounting CSV file
We realize that not all businesses use the same accounting software. For that reason, we have made it easier than ever to upload a list of business transactions using a CSV file! To begin, you'll want to check with your accounting team. Let them know you're looking for a CSV file of transactions surrounding any part of your business that might have a carbon emission associated with it such as travel, shipping, rental cars, hotel stays, fuel purchases, and utilities. In the image below you can see the examples of transaction types we'd like to capture:
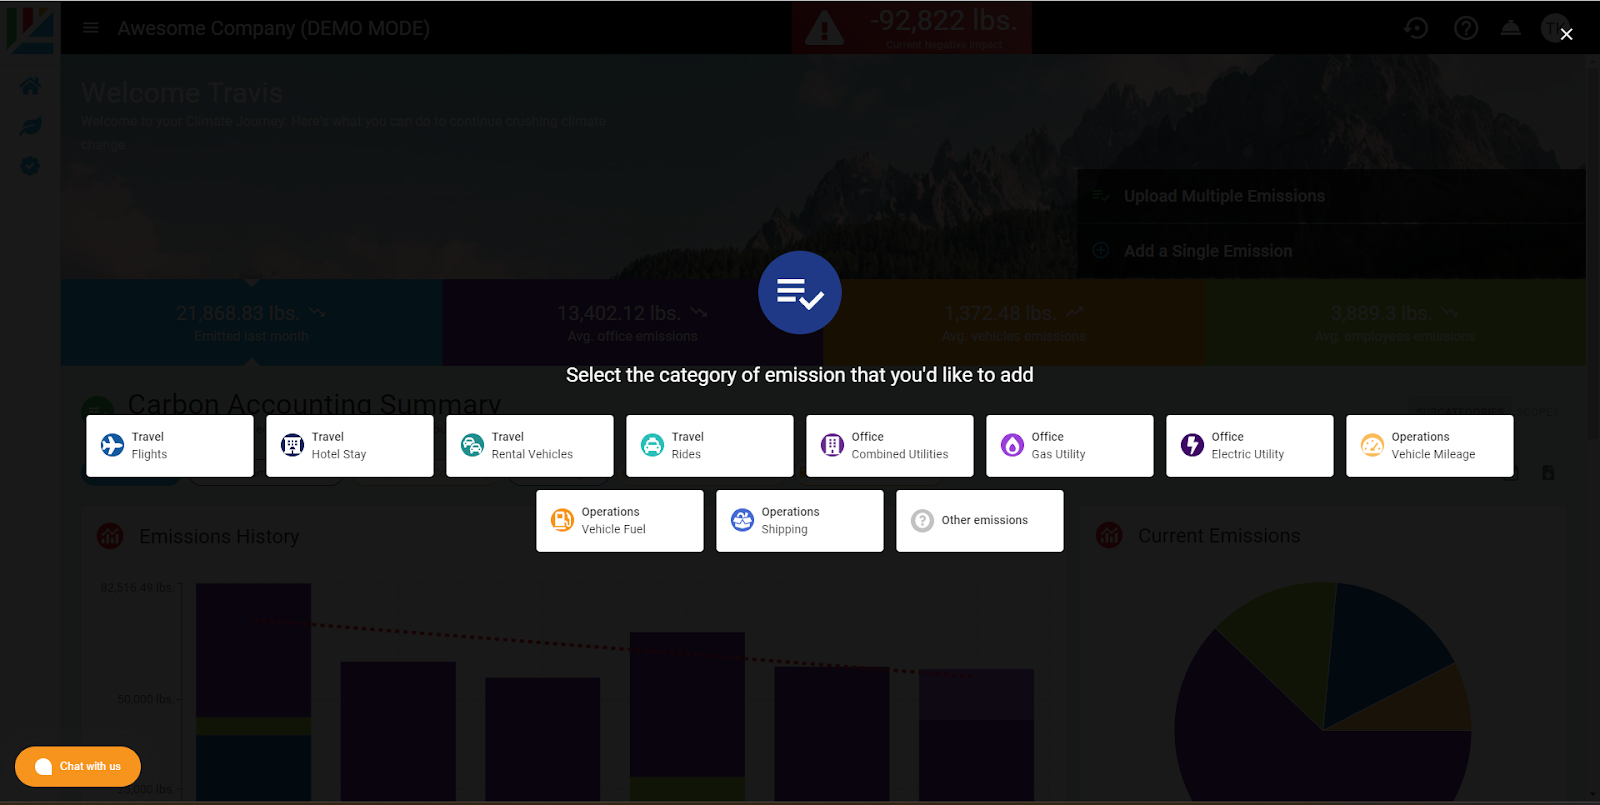
CSV File: You're CSV will need to have a few key columns in order to upload successfully: Date, Vendor, Category, and Value.
Related Articles
Spend Based Emissions Accounting
Starting in April of 2024 Aclymate customers can take advantage of our spend based and vendor management tools to achieve even greater visibility into their emissions footprint, as well as the supply chain they engage with. Vendor Setup There are ...Accounting for Flights
Frequently travel by plane to different work-related events? With Aclymate, we make accounting for these flights simple. Airplane travel is part of your Scope 3 emissions, and should be considered while accounting for your business' emissions. If ...Accounting- How to get the data I need out of my accounting software?
Vendor & Purchasing Information Much of your company's carbon footprint comes from the products and services you buy. Here's what we need: You have two options: Option 1: Connect your QuickBooks Online account directly in the Aclymate app. Option 2: ...MyAclymate- The personal carbon accounting tool
What is the myAclymate Survey? Before you can receive your impact report, we invite you to fill out the myAclymate survey, a fast and easy carbon footprint calculator designed to ask you a series of questions that will help us accurately estimate ...How to pull a report
In Aclymate, there are few different ways to visualize and extract the useful emissions data you need for your own reporting purposes. When viewing the main Dashboard you'll see a breakdown of your emissions by category (bar graphs) over time, and on ...